Sports Bettors: 10,000 Monte Carlo Runs to Size Stakes and Avoid Ruin

Monte Carlo betting simulation takes your win rate, your average odds, and your staking rule, then runs thousands of hypothetical betting sequences to show you the range of bankroll outcomes you should realistically expect. Instead of one tidy prediction, you get a distribution: a median result, a worst-case band, a best-case band, and a probability of ruin. That distribution answers the three questions that actually matter before you bet real money: how big should your stakes be, where should you cut losses, and does your model of your own edge survive contact with variance.
TL;DR:
- Monte Carlo simulations reveal the full range of possible bankroll outcomes, including worst-case, best-case, and ruin probabilities, not just the expected value.
- Accurate inputs, especially win probability, odds, and correlation assumptions, are crucial; sensitivity checks help validate the robustness of the results.
- Larger simulation counts, ideally over 10,000 runs, improve the reliability of tail risk estimates like ruin and drawdown.
- Different staking rules impact risk and growth profiles, with fractional Kelly balancing upside potential and volatility more effectively than flat staking or Martingale.
- Automated backtesting platforms help maintain consistent evaluation, track real results against simulations, and prevent overconfidence based on flawed assumptions.
Table of Contents
- What Is Monte Carlo Simulation Betting and Why Does It Matter?
- Core Inputs and Model Choices for a Credible Simulation
- How to Run a Monte Carlo Simulation Step by Step
- Reading Your Results: Median, Percentiles, and Risk of Ruin
- How Staking Strategies Perform Under Monte Carlo Testing
- Common Mistakes and Sensitivity Checks Worth Running
- Applying Monte Carlo in Practice With a No-Code Backtest Platform
- When Monte Carlo Helps, and When It Doesn’t
- Turn This Simulation Workflow Into a Repeatable Habit
- Sources
What Is Monte Carlo Simulation Betting and Why Does It Matter?
Monte Carlo simulation, in betting terms, means replaying your strategy thousands of times against randomly generated outcomes that respect your stated win probability and odds. Say you believe you win 55% of bets at average odds of 1.90, staking 2% of your bankroll each time. A single calculation gives you an expected value. A Monte Carlo run gives you thousands of different versions of that betting life, each with its own sequence of wins, losses, and losing streaks, so you can see the full spread of results instead of one number.
This matters because expected value and typical experience are not the same thing. The mean final bankroll across all simulated paths often gets dragged upward by a handful of extreme lucky runs, the way average income gets skewed by a few billionaires. The median, the outcome sitting right in the middle of all simulated paths, usually reflects what a real bettor should expect to see far more honestly than the mean does. If your mean projection shows a high value after many bets but your median is significantly lower, the median is the number to plan around.
Monte Carlo also captures something a single EV calculation cannot: path dependency. Two strategies with identical long-run expected value can produce wildly different experiences along the way. One might grind up steadily; the other might survive a 40% bankroll drawdown in month three before recovering. You would never see that risk in a spreadsheet formula that just multiplies probability by payout. You only see it by generating thousands of individual paths and looking at what happens bet by bet.
What a Monte Carlo run typically surfaces:
- The median final bankroll after your chosen number of bets
- The 5th and 95th percentile outcomes, showing your realistic worst and best cases
- The probability that you finish ahead of where you started
- The probability of hitting a ruin threshold before the sequence ends
- The maximum drawdown a typical path experiences along the way
None of this replaces judgment about whether your win-rate estimate is any good. It just tells you, honestly, what happens to your bankroll if that estimate is correct and variance does what variance does.
Core Inputs and Model Choices for a Credible Simulation
Every Monte Carlo run rests on inputs you supply, and a simulation is only as trustworthy as the numbers you feed it. Practical bankroll simulators generally ask for the same core set of variables:
- Win probability — your honest estimate of how often the bet type wins, not a number that flatters your strategy.
- Average odds — the typical decimal odds you take on qualifying bets.
- Starting bankroll — the capital you’re actually willing to risk on this strategy, not your total savings.
- Number of bets per period — how many wagers you place per week, month, or season.
- Stake rule — flat stakes, percentage of bankroll, or a Kelly-based formula.
- Commission or vigorish — the built-in house edge, if your market applies one.
- Number of simulations — how many hypothetical sequences the model generates.
Beyond the raw inputs, you also have to make modeling decisions that shape how realistic the output is. The biggest one is whether bets are treated as independent events or correlated ones. Two same-day parlays on related outcomes, or two bets tied to the same match, are not statistically independent, and treating them as if they are understate your real risk. A basic simulator assumes independence by default, so if your strategy leans on correlated bets, you need to either model that correlation explicitly or read the ruin and drawdown numbers with extra skepticism.
A second decision is whether win probability stays constant across every simulated bet or varies to reflect real uncertainty in your edge. A fixed 55% assumption is simpler to build, but real edges drift with form, market efficiency, and sample size. Some bettors run a second pass with a lower win rate, say 52%, just to see how much the outcome distribution degrades.
A third choice is whether you use one average odds figure for every bet or sample odds from a realistic range. Betting markets rarely offer identical prices every time, and using a single flat number smooths over that variation in ways that can flatter your projected upside.
Pro Tip: Run every simulation twice: once with your best-guess win rate, and once with that win rate shaved by two to three percentage points. If the second run still shows a reasonable probability of profit, your edge has some real margin for error. If it collapses, your original estimate was doing all the work.
How to Run a Monte Carlo Simulation Step by Step
You don’t need custom software to get useful numbers. Three approaches cover almost every bettor, from someone testing an idea on a Sunday afternoon to an analyst building a repeatable process.
Excel or Google Sheets, for a quick manual check. Set up one row per simulated bet. Use RAND() to generate a random number between 0 and 1, then an IF() formula that compares it against your win probability to mark the bet a win or loss. Multiply the result by your stake and odds, then run a cumulative sum down the column to track bankroll bet by bet. Copy that column across a few hundred simulated sequences, and pull percentiles across the final values using PERCENTILE.INC(). Excel handles a few hundred to a few thousand simulated paths comfortably, but it slows down fast past that, since every recalculation touches every cell.
Python, for anyone running larger or repeatable simulations. The workflow is short: generate an array of random outcomes for every bet in every simulated sequence using a vectorized call like numpy.random.random(size=(num_simulations, num_bets)), compare that array against your win probability to get a win/loss matrix, then apply your staking rule across each row to build a bankroll trajectory. NumPy does this across tens of thousands of paths in seconds because it processes the whole array at once instead of looping bet by bet, and the official Python documentation on random number generation covers the underlying sampling functions if you want to understand what’s happening under the hood. Aggregate the final column of bankroll values with pandas to get your median, percentiles, and probability of ruin.
Online simulators, for a fast check with no setup. Before trusting one, confirm it lets you set every core input (win probability, odds, bankroll, stake rule, bet count, simulation count), supports the staking rule you actually use rather than just flat stakes, and reports percentile bands and probability of ruin rather than a single headline number.
However you run it, sample size drives reliability. Rough directional checks work with 1,000 simulations. For stable estimates of tail outcomes like probability of ruin and drawdown percentiles, aim for 10,000 or more; below that, the tails of your distribution bounce around from run to run in ways that can mislead you about how risky a strategy really is.
By the numbers: running 1,000 simulations gives you a rough directional read, but the same simulator research that recommends that floor also notes returns beyond roughly 50,000 runs shrink to marginal improvement, meaning 10,000 to 20,000 is usually the sweet spot between accuracy and run time on a normal laptop.

Reading Your Results: Median, Percentiles, and Risk of Ruin
The output screen of a Monte Carlo run throws a lot of numbers at you, but four of them do almost all the work.
The median final bankroll is the outcome sitting at the 50th percentile across every simulated path, and it’s usually the number to anchor your expectations on rather than the mean, which lucky outlier runs can inflate. If your median result after 1,000 bets is a 15% bankroll gain, that’s a more honest planning figure than a mean showing 40% growth pulled up by a few extreme paths.
Percentile bands, typically the 5th and 95th, tell you the realistic range around that median. A 5th percentile outcome that still shows a modest profit is a strong signal. A 5th percentile outcome that shows near-total bankroll loss means your “typical” median result is sitting on a much shakier foundation than it looks.
Here’s how the core outputs translate into action:
| Output | What it tells you | What to do with it |
|---|---|---|
| Median final bankroll | Your realistic typical outcome | Use this, not the mean, to set expectations |
| 5th percentile | Your realistic worst case | Set your bankroll floor and stop-loss around this band |
| Probability of ruin | Odds your bankroll hits zero (or your defined floor) | Reduce stake size if this exceeds your comfort threshold |
| Maximum drawdown | Deepest dip a typical path experiences | Prepare mentally and financially to survive it before it happens |
Probability of ruin is exactly what it sounds like: the share of simulated paths that hit your defined floor, whether that’s zero or some percentage of starting capital, before the sequence ends. Even a strategy with solid positive expected value can carry an uncomfortable ruin probability if stakes are too aggressive relative to bankroll.
Maximum drawdown matters as much for psychology as for capital. Knowing that number in advance is what lets you set a stop-loss or cut-loss rule using the percentile bands rather than reacting emotionally mid-drawdown.
One more use for these outputs deserves attention: they act as a reality check on your own edge estimate. If your actual results after a real sample of bets consistently land outside your simulated 5th to 95th percentile band, on the losing side, that’s a signal your input win probability was too optimistic, not just bad luck. A single bad month happens inside almost every simulated distribution. A pattern of results outside the band is a different problem entirely.
How Staking Strategies Perform Under Monte Carlo Testing
The staking rule you choose changes your outcome distribution as much as your win rate does, and running each rule through the same Monte Carlo setup makes the trade-offs concrete instead of theoretical.
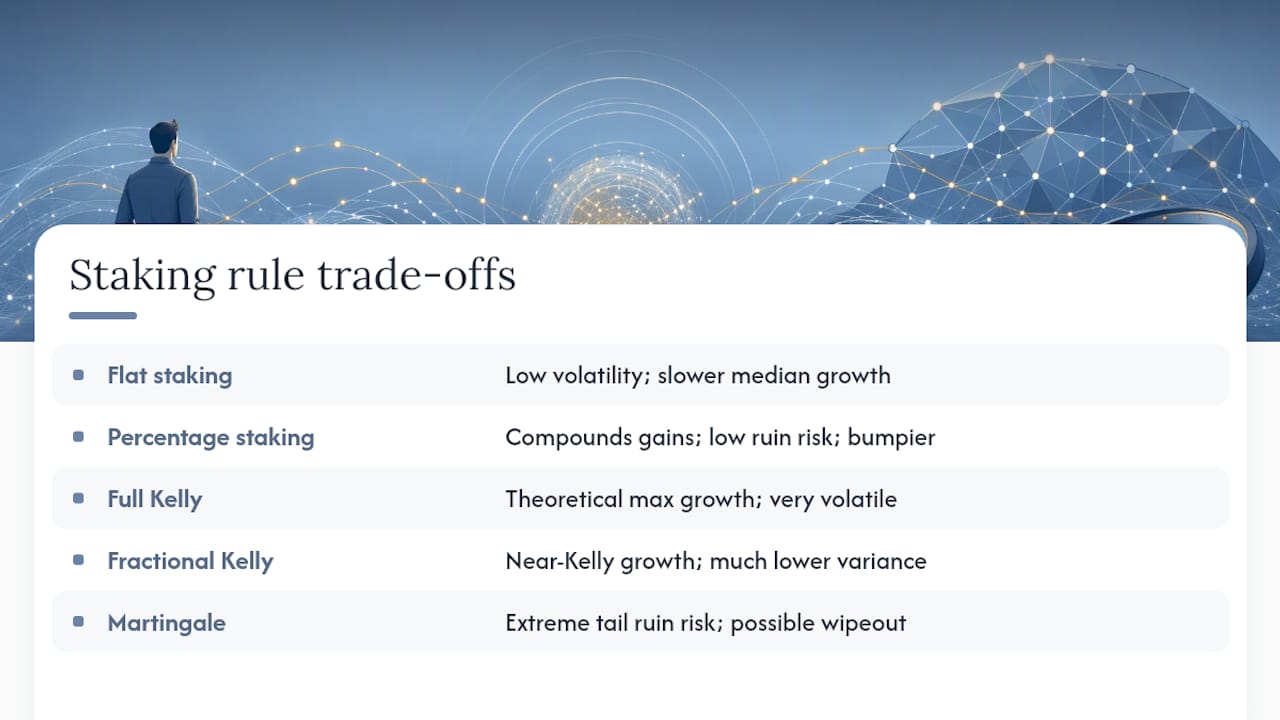
Flat staking means betting the same fixed amount every time, regardless of bankroll size. It produces the most predictable, low-volatility bankroll curve of the group, but it also fails to compound gains, so median growth tends to lag other approaches when your edge is genuinely positive.
This compounds naturally: stakes shrink during losing streaks and grow during winning ones, which caps ruin risk near zero at reasonable percentages while still capturing upside. The trade-off is a bumpier ride than flat staking, since your dollar stake size swings with bankroll.
Kelly staking sizes each bet mathematically based on your edge and the odds offered, and it maximizes long-run bankroll growth in theory. In practice, full Kelly is brutally volatile, especially when your win-rate estimate is even slightly off, which it almost always is to some degree. Fractional Kelly, particularly half-Kelly, captures most of the growth advantage while meaningfully cutting variance and drawdown depth, and it’s the version most disciplined bettors actually use.
Martingale, doubling your stake after every loss to chase a single win that recovers the whole streak, deserves a direct warning. Monte Carlo runs on Martingale consistently show a tail risk profile that no other staking rule matches: long stretches where the bankroll curve looks fine, followed by a single losing streak that wipes out the account entirely, because stake sizes grow exponentially with each consecutive loss. It’s the clearest example of why looking only at a median outcome, without checking the tail percentiles, can mask the strategy that will eventually ruin you.
For most bettors working with a real, tested edge, percentage staking or fractional Kelly gives the best balance between growth and survivability. Flat staking is the safer and slower default when you’re still validating whether your edge is real at all.
Common Mistakes and Sensitivity Checks Worth Running
The single most common way a Monte Carlo simulation misleads people isn’t a flaw in the math. It’s an input problem. Every simulator explainer worth reading makes the same point in different words: good inputs beat sophisticated models, and an overstated win-rate estimate produces a distribution that looks far healthier than your real results will ever be.
The fix is a simple set of sensitivity checks, run before you trust any output:
- Rerun the simulation with your win probability lowered by 2 to 5 percentage points and compare the ruin probability and median outcome to your original run.
- Rerun it with odds sampled from a realistic range instead of one flat average, especially if your actual bets span different markets or bookmakers.
- Test at least two stake sizes, since a strategy that looks safe at 1% of bankroll can show meaningfully higher ruin risk at 3%.
- Confirm your simulation count is at least 10,000 for any number you plan to act on, particularly probability of ruin and drawdown percentiles, since smaller runs produce noisy tail estimates that shift noticeably if you rerun them.
- Run the whole simulation two or three times with different random seeds and check that your headline numbers stay reasonably consistent between runs.
Pro Tip: Keep a short written record of every assumption behind a simulation, your win-rate source, your odds range, your stake rule, and the date you ran it. Betting edges drift over time, and a simulation from eight months ago built on stale assumptions is worse than no simulation at all if you’ve forgotten what it was based on.
A short checklist covers the rest: document your assumptions before you run anything, always report a percentile range rather than a single number when the result matters, and treat any single simulation run as a starting estimate, not a final verdict.
Applying Monte Carlo in Practice With a No-Code Backtest Platform
Running the workflow above by hand works, but it’s tedious to repeat every time you tweak a strategy idea. That’s the practical gap a no-code backtest platform like Backstedge is built to close: you define your staking rule and selection criteria once, and the platform maps those inputs onto historical match data the same way a Monte Carlo model maps them onto simulated outcomes.
The advantage isn’t just speed. It’s consistency. Manually rerunning sensitivity checks across five staking rules and three win-rate assumptions invites shortcuts, and shortcuts are exactly where overconfidence creeps in. Automated tracking and stability analysis features help catch the same thing a good Monte Carlo run catches: whether your results over time look like normal variance around a real edge, or whether performance is drifting in a way that suggests the original edge estimate was optimistic.
A few concrete experiments worth running on a platform like this:
- Backtest the same betting rule under flat, percentage, and fractional Kelly staking, and compare the resulting drawdown and volatility, similar to the comparison a Monte Carlo run performs synthetically.
- Track actual results against the percentile bands your own Monte Carlo simulation predicted, and flag it when real performance sits outside typical percentile ranges for a sustained stretch.
- Compare stability across different qualifying-match filters to see whether tightening your criteria reduces variance or just reduces sample size.
…
None of this replaces sound judgment about whether your original edge is real. It just removes the friction between having a strategy idea and finding out, with real numbers, whether it holds up.
When Monte Carlo Helps, and When It Doesn’t
Monte Carlo earns its keep when you have a repeatable bet type with an estimable edge and enough independence between wagers that treating them as separate random draws is a reasonable approximation. Value bets on a specific market inefficiency, systematic angles applied across a full season, staking-rule comparisons. All of that is exactly what the method was built for.
It earns a lot less trust for one-off situations: a single high-stakes wager on an outcome you’ll never repeat, or a portfolio of bets so tangled together, same game, correlated markets, shared risk factors, that the independence assumption stops resembling reality. Feed a simulator bad correlation assumptions and it will hand you a confident-looking distribution built on a false premise. The output looks precise. The precision is fake.
The honest way to use this method is as a discipline tool, not an oracle. It won’t tell you whether your edge is real. It will tell you, if your edge is real, roughly what surviving the variance around it actually looks like, including the stretches that will test your resolve to stick with a sound strategy. That’s a more modest promise than most betting advice makes, and it’s also one Monte Carlo can actually keep.
— Yerowell
Turn This Simulation Workflow Into a Repeatable Habit
A no-code platform can provide a way to backtest your actual staking rules and selection criteria against real historical match data, then watch stability metrics update automatically as new results come in, instead of rebuilding a spreadsheet every time your strategy changes.

The workflow mirrors what this article just walked through. You set your rule, your stake sizing, and your qualifying criteria once, and Backstedge tracks how the strategy would have performed across historical matches, then keeps tracking it as new matches qualify. Instead of running a Monte Carlo check every time you want a sanity read on drawdown or consistency, you get an automated version of that same question, answered continuously rather than in a single static run. Some platforms offer free plans to build and backtest strategies before committing to anything further, so you can see whether your idea holds up against real data before deciding it’s worth refining.
If you’ve been running the math by hand, the next step is straightforward: start backtesting your strategy on Backstedge and see what your edge actually looks like against historical matches, not just a spreadsheet formula.