5 Seasons of Soccer Backtests: Favorites vs Underdogs on Closing Odds

5 Seasons of Soccer Backtests: Favorites vs Underdogs on Closing Odds
Published soccer backtests consistently show favorites winning more often but rarely turning a profit once bookmaker margin is applied, while blind underdog staking tends to lose even more. Neither side works as a standalone strategy. The real edge comes from layering filters like home advantage, league, and odds band on top of the category, then measuring the result against closing odds over enough seasons to trust the number. Backstedge’s own five-season tests below show exactly where each side lands.
TL;DR:
- Betting favorites with a low odds threshold (under 1.50) across five seasons in major European leagues shows a consistent negative ROI even after accounting for bookmaker margins.
- Larger sample sizes, ideally over 300 to 500 bets, are necessary to reliably evaluate ROI and win rate, especially for narrow odds bands or lower-frequency bets.
- A backtest must include precise data collection, realistic timing, appropriate stake sizing, and out-of-sample validation to avoid biases such as lookahead or overfitting.
- Combining filters like home advantage, league, and odds bands enhances the chance of finding a profitable edge, as simple blind betting on favorites or underdogs generally yields losses.
- Using tools like Backstedge allows testing specific betting rules against historical data, helping bettors refine thresholds and ensure results are not driven by outlier seasons.
Table of Contents
- How Do Favorites and Underdogs Compare in Win Rate and ROI?
- What Metrics Should a Favorites vs Underdogs Backtest Report?
- Building a Favorites vs Underdogs Backtest Pipeline
- What the Data Says: Favorites vs Underdogs Backtested Over 5 Seasons
- Common Traps That Wreck a Backtest
- Choosing the Right Sample for Favorites and Underdogs
- How Odds Ranges Change Backtest Validity
- Comparing Bet Sizing for Favorites vs Underdogs
- Build and Backtest Your Own Favorites vs Underdogs Strategy
- Sources
- FAQ
How Do Favorites and Underdogs Compare in Win Rate and ROI?
Here’s the arithmetic that trips up most bettors: win rate and profitability are not the same thing, and betting the side that wins more often is often the losing move.
Every price implies a break-even win rate. At decimal odds of 1.80, you need to win roughly 55.6% of the time just to break even, before the bookmaker’s margin eats into that number further. Favorites get priced low precisely because the market expects them to win often, so their higher win rate is already baked into the price. Underdogs pay more per win, but they need a much rarer kind of edge, an actual mispricing, to turn a profit over a large enough sample to matter.
An MLB dataset spanning 51,522 games from 2004 to 2024 makes the point bluntly: favorites won 58.2% of games but blind favorite betting still returned negative 1.8% ROI. Higher win rate, still a loser. That’s a different sport, but the same math governs every league, every market, every price.
That’s why a real comparison needs more than a scoreboard. Five dimensions matter:
- ROI (yield), the profit or loss per unit staked
- Win rate, how often the bet actually lands
- Number of bets, whether the sample is large enough to trust
- Worst drawdown, the longest losing stretch a bettor would have had to survive
- Season-by-season variability, whether the result depends on one lucky or unlucky year
Large football samples tell a similar story to the MLB numbers. One analysis of a broad soccer dataset found that backing every favorite returned a negative ROI while backing all underdogs returned a more negative ROI, with real variation by league and odds band. Favorites are usually the least bad option. Underdogs, taken as a blind category, are usually the worst.
What Metrics Should a Favorites vs Underdogs Backtest Report?
A backtest that only reports “I would have made money” is not a backtest, it’s a story. Here’s what separates a number you can trust from one you can’t.
- ROI (yield): net profit divided by total stake, always calculated after the bookmaker’s margin is baked into the odds you actually got, not some theoretical fair price.
- Win rate: the raw percentage of winning bets, useful only when read alongside the odds, since a 70% win rate at 1.30 can still be a loser.
- Closing-line value (CLV): how your bet’s odds compare to the closing price right before kickoff. Beating the closing line consistently is widely treated as the strongest available signal that you found a genuine mispricing rather than a lucky run, because the closing line reflects the market’s best final estimate of true probability.
- Number of bets: the sample size behind every other number on this list.
- Maximum drawdown: the deepest peak-to-trough loss in the running bankroll, which tells you what you’d have needed to survive emotionally and financially.
- Variance across seasons: whether the average result holds up year to year or gets carried by one outlier season.
On sample size, treat anything under 300 to 500 bets as a preliminary read at best. Low-frequency situations, like a narrow odds band or a single league’s underdogs, usually need 1,000 or more settled bets before the ROI number stabilizes enough to act on.
If the strategy still shows a positive edge after that stress test, it’s a lot more likely to survive contact with real bookmaker margins.*
Building a Favorites vs Underdogs Backtest Pipeline
A defensible backtest is a pipeline, not a spreadsheet you eyeball once. Here’s the sequence that keeps the result honest.
- Collect timestamped data. Pull historical odds and final results with timestamps attached, ideally both a pre-kickoff snapshot and the closing line. A Python-based tutorial from OddsPapi walks through exactly this kind of pipeline, including sample strategies like “always bet the favorite” and CLV tracking.
- Define the categorical rule precisely. “Favorite” needs a hard threshold, for example odds under 1.50, not a vague sense of who’s expected to win. Same for underdogs, say odds over 2.50. Layer in filters like home or away and league to avoid mixing incompatible samples.
- Simulate realistic bet timing. Use the odds available at the moment your rule would have actually triggered, not the odds with hindsight. Testing against closing odds when you’d have actually bet earlier is a common way backtests inflate their own results, since lines move as sharper money comes in and early prices are usually softer.
- Choose a staking method and stick to it. Flat one-unit stakes are the simplest and most transparent. Fractional Kelly, usually half-Kelly, is the standard alternative when you have a confident probability estimate, because full Kelly is brutally sensitive to small errors in that estimate.
- Validate out of sample. Split your data into blocks, train on three seasons, test on the next, then roll forward one season at a time. This walk-forward approach mirrors how a strategy would actually get deployed instead of letting the model peek at data it shouldn’t know yet.
Bootstrapping and Monte Carlo simulation round out validation. Running thousands of resampled simulations gives you a realistic range for drawdown and a genuine estimate of ruin risk, rather than a single lucky path through history.
What the Data Says: Favorites vs Underdogs Backtested Over 5 Seasons
Backstedge ran five full seasons, 2021/22 through 2025/26, across five major European leagues, using real closing odds and flat one-unit stakes on every bet. No theoretical prices, no hindsight adjustments.
The home favourites strategy tests home teams priced under 1.50. The away favourites strategy applies the same favorite logic to road teams. The home underdogs strategy flips the lens to home sides priced as the outdog.
Each page carries its own season-by-season table, so you can see whether the five-season average was carried by one strong year or held up consistently. That distinction matters more than the headline number, since a strategy can post a respectable five-season ROI while masking a single brutal season that would have wiped out a poorly sized bankroll. Check the worst drawdown figure on each page against your own bankroll before assuming any of these three categories is bettable on its own.
Common Traps That Wreck a Backtest
Most backtests fail quietly, not loudly. Here’s where the damage usually happens.
- Lookahead bias: using information that wasn’t actually available at bet time, like a final injury report from an hour before kickoff, or worse, the closing odds themselves as your entry price.
- Survivorship bias: building your dataset from leagues, teams, or seasons that happen to still exist or perform well today, quietly excluding the relegated teams and dead leagues that would have dragged the average down.
- Overfitting to one sample: tuning your odds thresholds until one specific dataset looks profitable, then watching the edge evaporate the moment you test a different season or league.
- Mis-timed staking: assuming you’d have gotten the closing price when in reality you’d have bet hours or days earlier, at a worse number.
Run robustness checks before trusting any result: drop one season at a time and see if the ROI survives, shift your odds threshold by a few ticks in each direction, and test at half your intended stake size to see if the edge holds proportionally.
Pro Tip: If removing your single best season turns a winning backtest into a losing one, you don’t have a strategy. You have one good year.
Choosing the Right Sample for Favorites and Underdogs
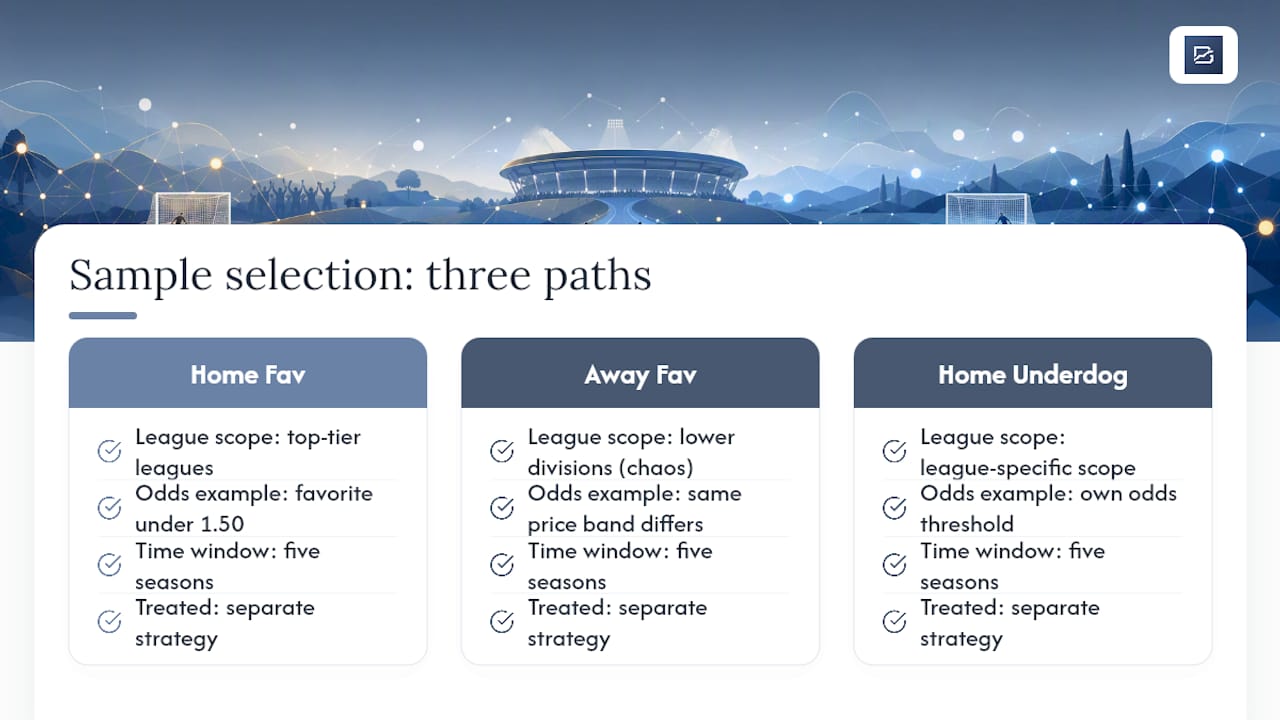
Sample selection is where most favorites-vs-underdogs backtests quietly go wrong, usually before a single bet gets simulated. The category itself, favorite or underdog, is too broad to test alone with any confidence. League matters enormously: a favorite under 1.50 in a top-tier league with tight officiating and deep squads behaves differently than the same price band in a lower division with more chaos and rotation.
Home and away context changes the picture again. A home favorite benefits from crowd support and travel-free preparation in a way an away favorite simply doesn’t, which is exactly why Backstedge tests them as separate strategies rather than lumping them together. Time period matters too: five seasons captures enough variation to smooth out one weird year, but pulling only the most recent season, or cherry-picking a stretch where a particular league had unusual upset rates, will hand you a number that doesn’t generalize.
The safest approach treats each combination, home favorite, away favorite, home underdog, as its own sample with its own threshold, its own league scope, and its own multi-season window. Mixing a 1.20 favorite with a 1.48 favorite in the same bucket blurs two genuinely different bets into one misleading average, since the break-even win rate at those two prices differs by several points.
How Odds Ranges Change Backtest Validity
A backtest of “all favorites” is really a backtest of dozens of different bets stitched together, and that’s the hidden problem with wide odds bands. Lump them into one bucket and you get an average that describes neither bet accurately.
Narrower odds bands generally produce more reliable, more interpretable results, but they cost you sample size, and a narrow band tested on too few matches is just noise dressed up as precision. The fix is to test multiple bands separately, say 1.20 to 1.35, 1.35 to 1.50, and 1.50 to 1.65 for favorites, and compare ROI and win rate across bands rather than assuming one number represents the whole category.
The same logic applies harder to underdogs, where the odds range stretches much wider. A 2.20 underdog and a 4.50 underdog are close to different sports in terms of what has to go right for the bet to land. Backstedge’s home underdogs test, like the favorites tests, holds to a specific defined threshold rather than an open-ended “any underdog” bucket, which is exactly why the published number means something more concrete than a generic underdog stat you’d find elsewhere.
Comparing Bet Sizing for Favorites vs Underdogs
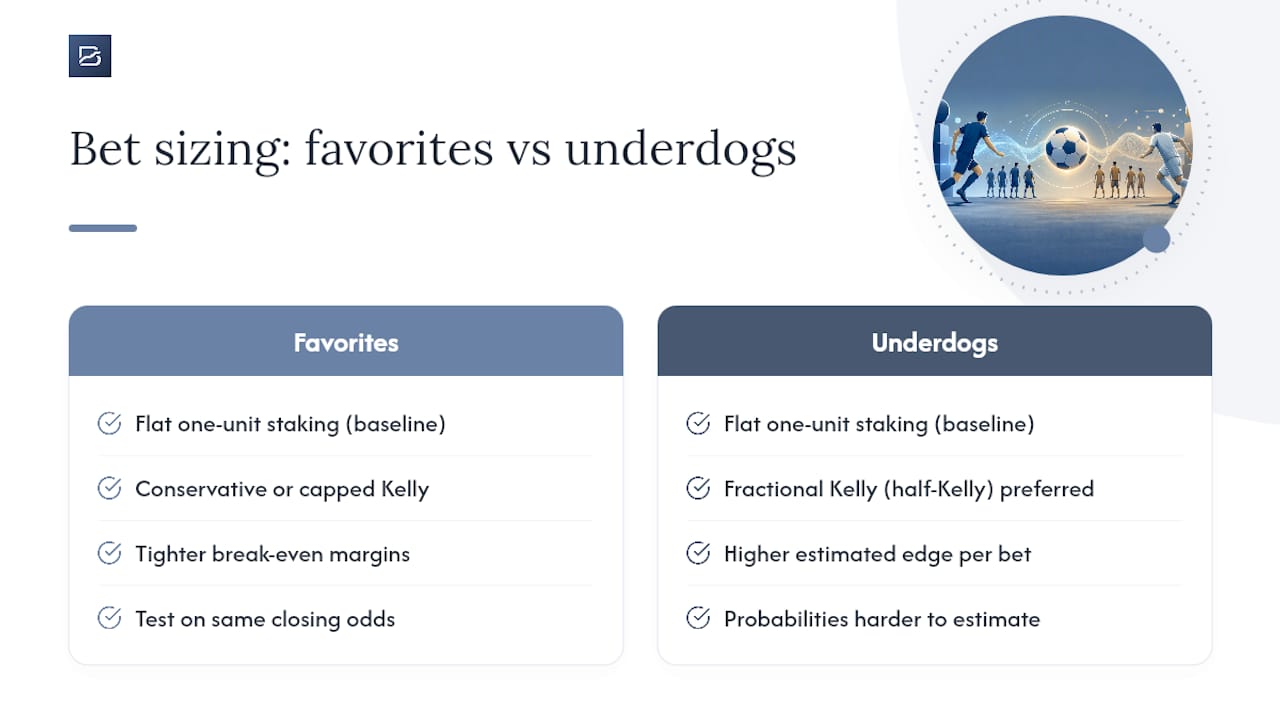
Flat one-unit staking is the fairest starting point for any favorites-vs-underdogs comparison, since it isolates the strategy’s edge from any staking cleverness and matches how Backstedge reports every strategy page. It’s also the right choice for anyone still validating whether a category holds an edge at all, because variable sizing on top of an unproven edge just adds noise.
Once you believe you’ve found a genuine, validated edge, fractional Kelly staking becomes the more interesting option, particularly for underdogs. Kelly sizing bets in proportion to your estimated edge, which sounds appealing for higher-odds underdog bets where a real edge can be larger in percentage terms. The catch is that full Kelly is punishing when your probability estimate is even slightly off, and underdog probabilities are inherently harder to estimate precisely than favorite probabilities. Half-Kelly is the common compromise, capturing most of Kelly’s long-run growth while meaningfully cutting the tail risk from estimation error.
For favorites, the tighter break-even margins mean sizing errors get punished faster, so conservative flat staking or a heavily capped Kelly fraction tends to be the safer default. Bankroll management resources like ParlayGeeks cover the practical mechanics of sizing and staking discipline in more depth if you’re building this out for the first time. Whatever method you pick, test it against the same closing-odds dataset you used for the win rate and ROI numbers, since a staking method that looks great on paper can still blow up against real drawdown sequences.
Build and Backtest Your Own Favorites vs Underdogs Strategy
Reading someone else’s five-season numbers only gets you so far. The real value shows up when you test your own thresholds, your own league filters, and your own odds bands against real historical data, rather than trusting a single published bucket to match your exact betting style.
Backstedge is built for exactly this kind of testing. You set up a rule, home favorite under 1.45 in one specific league, for instance, without writing a line of code or wrestling a spreadsheet into shape. The platform runs it against five seasons of real closing odds with flat one-unit stakes, the same standard used throughout this article, then hands you back ROI, win rate, worst drawdown, and a season-by-season table so you can see whether your version holds up better than the broad home favourites or home underdogs pages you just read. From there you can narrow the odds band, add a league filter, or flip the test from home to away and rerun it in minutes.
Once a rule looks promising, Backstedge’s automated detection flags future matches that qualify, so you’re not manually scanning fixture lists every week. If you’re ready to see how your own thresholds perform, start building your first backtest on Backstedge.
Sources
- How to Backtest a Betting Model with Free Historical Odds — OddsPapi blog
- MLB favorites vs underdogs betting results — ProComputerGambler
FAQ
Is It Better to Bet Favorites or Underdogs?
Neither wins outright as a blind category. Published soccer and MLB data show favorites usually post a smaller loss than blind underdog staking, but both lose money without added filters like league, home advantage, or a specific odds band.
Can ChatGPT Backtest a Betting Strategy?
A large language model can help write backtesting code or explain statistical concepts, but it can’t run a real backtest without being connected to actual historical odds and results data. Purpose-built tools like Backstedge or coded pipelines using timestamped historical odds handle the actual computation.
What Is the Best Way to Backtest a Betting Strategy?
Use timestamped historical odds and results, define precise entry rules, simulate realistic bet timing against closing lines, apply consistent flat or fractional staking, and validate with walk-forward testing across at least 300 to 500 bets, ideally more for narrow odds bands.
How Many Bets Do You Need for a Reliable Backtest?
Treat results under 300 to 500 bets as preliminary. Low-frequency setups, like a narrow odds band or a single league’s underdogs, generally need 1,000 or more settled bets before the ROI figure stabilizes enough to trust.