4 Step Odds Range Filter Backtest Using Timestamped Odds for Bettors

4 Step Odds Range Filter Backtest Using Timestamped Odds for Bettors
An odds range filter backtest checks whether a betting strategy stays profitable when you only take prices inside a defined interval, like 1.80 to 2.20, instead of every bet a rule generates. It works because narrow odds bands often behave differently than the wider market, and the backtest is what separates a real edge from a lucky stretch. Run it on timestamped historical odds, pre-register your ranges before you look at results, and require a minimum sample before you trust any number.
TL;DR:
- Narrow odds ranges require larger datasets, typically at least a few hundred bets per interval, to produce statistically reliable backtest results.
- Using timestamped odds data near the decision point and multi-book prices prevents inflated profitability estimates caused by static or end-of-day prices.
- Pre-registering the odds ranges and reasoning before backtesting is crucial to avoid overfitting and post-hoc bias, especially when testing multiple intervals.
- Combining odds range filters with additional conditions can improve results if filters are added sequentially, but each combination must be pre-registered to prevent data snooping bias.
- Running season-by-season analysis and stability tests, such as bootstrap and walk-forward methods, helps confirm that the identified edge is consistent and not just a result of random fluctuations.
Table of Contents
- What Is Odds Range Filter Backtesting and Why Bother?
- How Do You Choose Odds Ranges to Test?
- Why Timestamped Odds Data Matters More Than You Think
- Step-by-Step: How to Run an Odds Range Filter Backtest
- Reading the Numbers: ROI, Strike Rate, Drawdown, and Confidence
- Common Pitfalls That Quietly Wreck a Backtest
- Combining Odds Range Filters With Other Betting Rules
- What the Data Says: Home Favorites Backtested Over 5 Seasons
- Tools and Software for Running These Backtests
- Stress-Testing Results: Bootstrap and Walk-Forward Methods
- Build and Backtest Your Odds Range Filters in Backstedge
- Sources
- FAQ
What Is Odds Range Filter Backtesting and Why Bother?
An odds range filter is a rule that keeps only the bets whose price falls inside a set interval, say 2.00 to 2.50 for home underdogs, and discards everything outside it. Bettors use this for a simple reason: a strategy that that looks flat across all odds sometimes hides a strong pocket of profit in one narrow band and a losing pocket in another. Backtesting that filter answers one question: would this specific slice of bets have made money at the prices actually available, not at some theoretical average.
The trade-off is unavoidable. Narrow the range and you isolate a cleaner signal, but you also shrink your sample size and widen your margin of error. Widen it and you get more bets to analyze, but you dilute whatever edge exists in the tightest part of the band. Backtesting odds filters at several widths side by side is usually how you find the sweet spot.
- Common use cases: home favorites in a tight price band, away underdogs above a certain price, draws between closely matched teams
- The backtest measures realized ROI at offered prices, not theoretical value
- Tighter ranges need bigger raw datasets to reach a usable sample count
How Do You Choose Odds Ranges to Test?
Picking the range before you see the results is the single biggest thing separating a legitimate backtest from a curve-fitting exercise. Most bettors go wrong by scanning a chart of returns by odds bucket, spotting a hot zone, then calling that their “strategy.” That’s not analysis. That’s picking the winning lottery numbers after the drawing.
There are two workable starting frameworks which bettors often find easier to understand by reviewing how betting odds work. The first is market-driven buckets: split odds into intervals that reflect how bookmakers price risk, such as 1.50 to 1.80, 1.80 to 2.20, 2.20 to 3.00, and 3.00 and above.
- Draft two or three candidate ranges based on a betting hypothesis, not a results scan
- Set a minimum sample-size threshold per range before you start, typically 100 to 200 qualifying bets as a floor
- Write down the ranges and the reasoning in a document or spreadsheet before running any backtest
- Run the backtest exactly as pre-registered, then report every range’s outcome, winners and losers alike
Pro Tip: Keep a running log of every range you’ve ever tested, including the ones that failed. If you only save the winners, you’re rebuilding the same post-hoc bias you were trying to avoid.
Why Timestamped Odds Data Matters More Than You Think
A backtest built on closing lines or a single daily snapshot tells you almost nothing about what you could have actually won. Odds move constantly between the opening line and kickoff, and the price available when your rule would have fired is rarely the price you see in a static dataset.
TheOddsAPI’s guidance on historical backtesting recommends using timestamped snapshots taken as close as possible to the moment a betting signal would have triggered, pulled across roughly 50 bookmakers, so you’re simulating the price you’d have actually gotten rather than a theoretical average. That distinction changes results more than people expect: a rule that looks profitable against mid-market prices can turn negative once you swap in the vig-inclusive price a bettor would have actually faced.
- Use snapshots timestamped near the decision or execution point, not end-of-day closing prices
- Pull multi-book data where possible and take the best realistically available price per timestamp
- Flag and exclude records with missing timestamps, suspended markets, or obvious price errors before simulation
- Never simulate against a vig-free or synthetic “fair odds” line
Bad timestamps or gaps in coverage quietly wreck a backtest. A single missing snapshot around a lineup announcement can make a losing bet look like a winner simply because the dataset skipped the price move that followed.
Step-by-Step: How to Run an Odds Range Filter Backtest
Running the backtest itself follows a predictable sequence, and skipping steps is where most homegrown spreadsheets fall apart.
- Define the rule and pre-register the odds range. Write the exact condition (market, side, minimum and maximum odds) before touching any data.
- Pull timestamped historical odds and apply the filter. Query your data source for matches where the odds fell inside your registered range at the relevant timestamp, producing your list of qualifying bets.
- Simulate execution with a real staking plan. Apply flat one-unit stakes (or whatever plan you’re testing), use the actual offered price including the bookmaker’s vig, and build in a small execution lag to account for the seconds or minutes between signal and bet placement.
- Compute season-by-season and rolling-window summaries. Break results into individual seasons and overlapping rolling windows so a single hot season can’t disguise a strategy that’s actually inconsistent.
The output you want from this process is a table, not a single number: bets, wins, strike rate, total profit, ROI, and worst drawdown, broken out by season. Backstedge’s published strategy pages follow exactly this format, showing five seasons of real closing odds with flat one-unit stakes so you can see whether a strategy’s edge is steady or driven by one outlier year.
By the numbers: a backtest that only reports a single aggregate ROI across five seasons is hiding the one detail that actually matters, which is whether that return came from one lucky year or held up across every season individually.
Reading the Numbers: ROI, Strike Rate, Drawdown, and Confidence
Five numbers matter for any odds-range backtest, and none of them means much in isolation. ROI per unit staked tells you the average return, strike rate tells you how often the bet wins, mean return per bet flags whether a small number of large-odds winners are propping up the whole result, worst drawdown shows the losing streak you’d need to survive, and number of bets tells you whether any of the above is trustworthy.
A moderate ROI on a small number of bets means almost nothing. A small positive ROI on a large number of bets across multiple seasons indicates potential significance. Run a basic confidence interval on the strike rate, and if the interval is wide enough to include break-even, treat the result as inconclusive rather than as an edge.
- Require a substantial number of bets before drawing conclusions, generally several tens of bets rather than just a few.
- Check ROI against both closing-line and best-available-price benchmarks, not just one
- Confirm the strategy stayed positive, or at least stable, across each individual season rather than only in aggregate
Pro Tip: If removing your single best-performing bet flips a strategy’s ROI from positive to negative, your sample is too fragile to deploy, no matter how good the headline number looks.
Common Pitfalls That Quietly Wreck a Backtest
Most bad backtests fail for the same handful of reasons, and every one of them is avoidable if you know to check for it.
- Testing against mid-market or closing prices instead of realistic execution prices with vig included, which TheOddsAPI’s backtesting guide specifically warns against
- Scanning dozens of odds ranges after the fact and reporting only the one that worked, a version of multiple-testing bias that inflates apparent edges
- Ignoring execution lag, the gap between when a signal fires and when a bet could realistically be placed
- Assuming a filter behaves the same way on new data as it did on the sample it was built from, when in fact narrow range filters can return more false positives under correlated conditions, similar to what range filter research documents in adjacent technical fields
That last point deserves a beat of explanation. Range filters, whether they’re sorting odds bands or database queries, are inherently probabilistic: a value inside your target range is always flagged correctly, but values near the edges can slip through as false positives depending on how tightly the boundaries are drawn. Research on adaptive range filters shows that filters which adjust to skewed or repeated query patterns produce fewer of these false positives than static filters, which is a useful analogy for why nudging your odds range boundaries by a few ticks and rechecking stability is worth the extra step. Validate with rolling windows, hold out at least one full season as an out-of-sample test, and always pre-register before you look at results.
Combining Odds Range Filters With Other Betting Rules
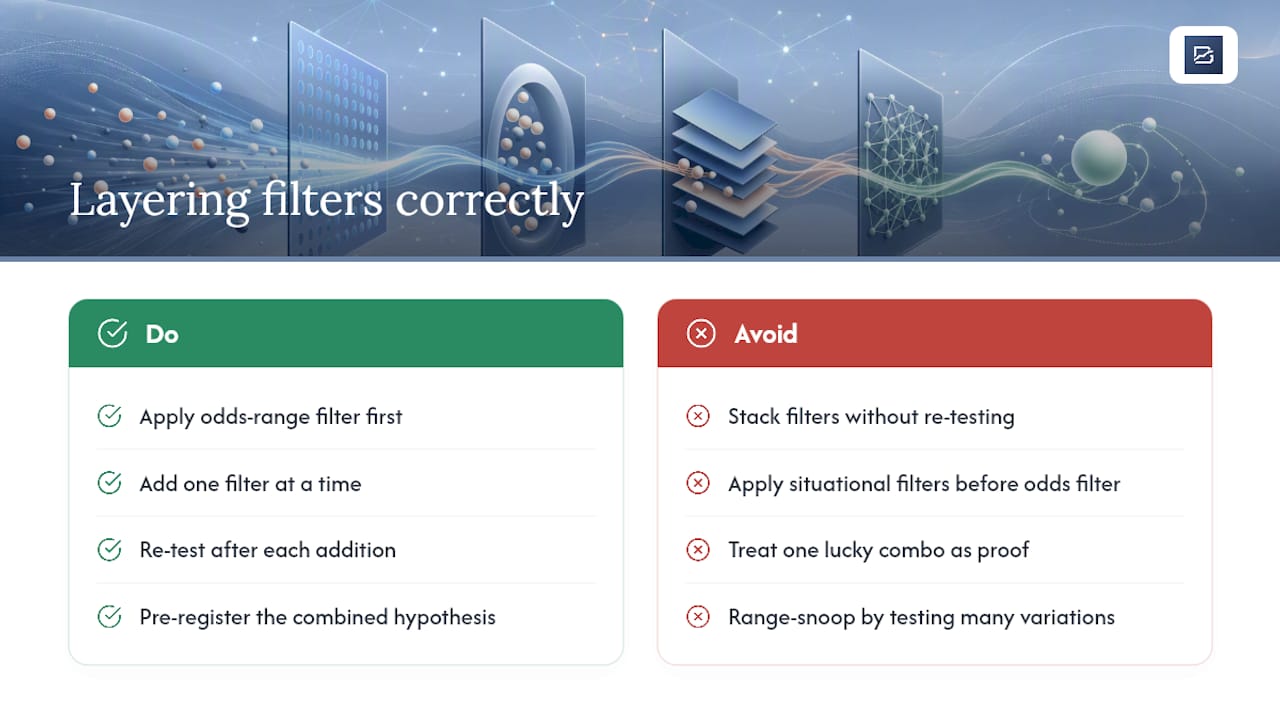
An odds range filter rarely works best alone. Layering it with a second, independent condition usually sharpens the signal instead of just adding noise, as long as you add filters one at a time and re-test after each addition.
The most common combinations bettors use are situational overlays: an odds range filter for home favorites priced between 1.60 and 1.90, stacked with a form filter requiring three or more wins in the last five matches, or the same odds band applied only to teams with a specific goal-scoring profile. Each additional filter should shrink your sample size and, ideally, improve either ROI or strike rate. If adding a filter shrinks the sample without moving either number, you’ve probably just found a smaller, noisier version of the same result.
Sequencing matters here. Apply the odds range filter first, since it’s usually the cheapest to compute and the easiest to audit against real market prices. Layer situational filters, like home or away form, rest days, or head-to-head history, on top of that qualifying pool rather than the other way around. This keeps each stage transparent, so when a combined strategy underperforms, you can trace the failure back to a specific filter instead of untangling a black box.
One caution: every filter you stack adds another opportunity for range-snooping bias, because you’re now testing multiple conditions rather than one. Treat a combined odds-range-plus-form strategy as its own hypothesis, pre-register the exact combination, and don’t let a good result from one combination convince you to test five more variations until one sticks.
What the Data Says: Home Favorites Backtested Over 5 Seasons
Backstedge’s published backtest for home favorites covers five seasons of real closing odds using flat one-unit stakes, reporting rules, ROI, profit, worst drawdown, number of bets, win rate, and a season-by-season breakdown for the strategy. That page is a working example of exactly the reporting format this article recommends: enough seasons and enough bets to judge whether an odds-range approach to home favorites holds up over time rather than in a single lucky year.
Tools and Software for Running These Backtests
You have three realistic paths for building an odds range filter backtest, and each one trades off setup time against flexibility.
Spreadsheets remain the entry point for most bettors, and they work fine for a single range on a modest dataset. The problem shows up once you want season-by-season breakdowns, rolling windows, and confidence intervals across several odds ranges at once. At that point, formula complexity balloons and errors creep in unnoticed.
Custom scripts in Python or R give you full control over staking logic, vig adjustments, and statistical tests, and they’re the standard choice among bettors comfortable with code. The tradeoff is time: building a script that correctly handles timestamped odds, execution lag, and multi-season reporting from scratch is a real project, not an afternoon task.
A no-code platform like Backstedge sits between the two. It lets you define an odds range rule, run it against historical match data, and get automated ROI, win rate, drawdown, and season-by-season output without writing a formula or a script. For data sourcing specifically, TheOddsAPI is a widely used source for the timestamped, multi-book historical odds snapshots that make the difference between a realistic backtest and an optimistic one. Whichever path you pick, the requirement is the same: timestamped execution prices, a pre-registered range, and enough bets to trust the output.
Stress-Testing Results: Bootstrap and Walk-Forward Methods
A single backtest run, even a clean one, only tells you what happened on one specific slice of history. Two additional techniques check whether that result is stable or just a product of how the data happened to fall.
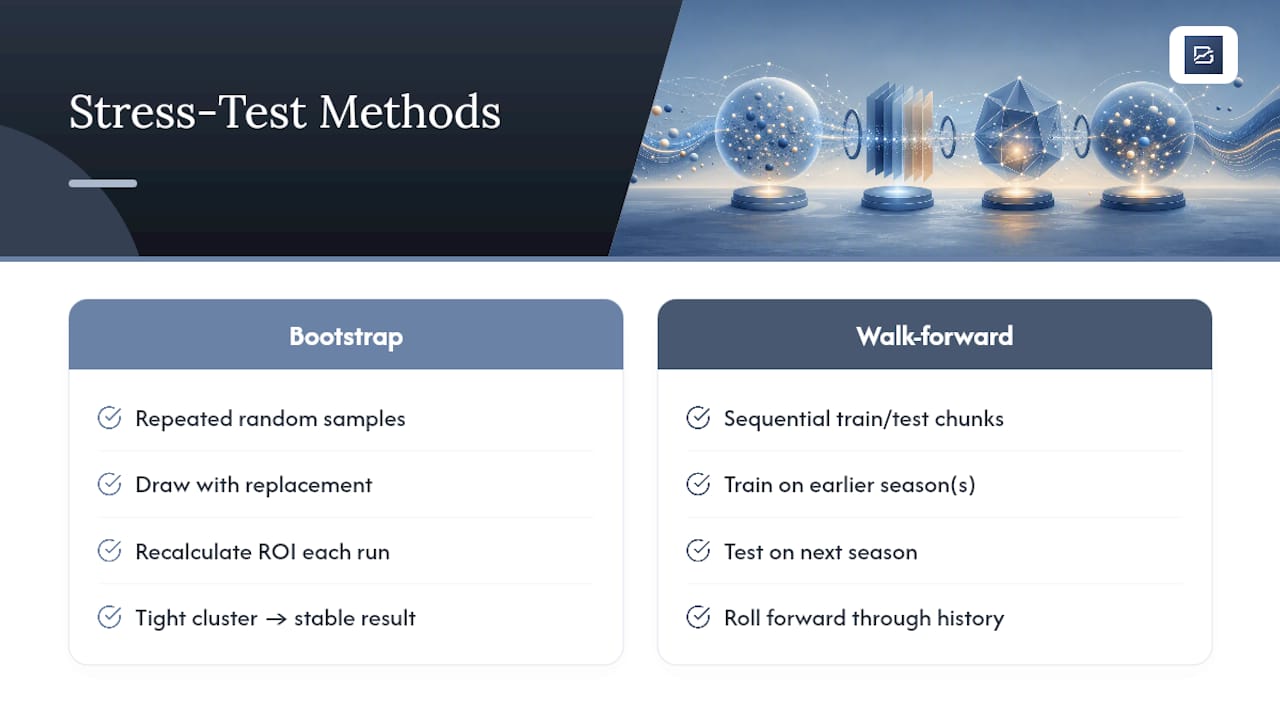
Bootstrap resampling works by repeatedly drawing random samples, with replacement, from your set of qualifying bets and recalculating ROI each time. If you run this a thousand times and get a tight cluster of outcomes around your original ROI, the result is fairly stable. If the bootstrap distribution swings wildly, your sample is too small or too dependent on a handful of outlier bets to trust.
Walk-forward analysis addresses a different weakness: the risk that you tuned your odds range using the full dataset, which means the backtest is partly fitted to the data it’s being judged on. Instead, you split history into sequential chunks, say train on season one, test on season two, then roll forward and train on seasons one and two, test on season three, repeating through your full dataset. A range that only performs well when it’s allowed to peek at the test period is not a real edge.
Neither method requires exotic statistical training to apply usefully. The core idea for both is the same: don’t trust a number generated from a single pass over a single dataset, and always leave some portion of your history unseen until the final check.
Build and Backtest Your Odds Range Filters in Backstedge
Everything covered above, pre-registering ranges, pulling timestamped odds, simulating realistic execution, and checking season-by-season stability, is exactly the workflow Backstedge is built to run.
Instead of stitching together spreadsheets and scripts, you define your odds range and any additional conditions through a no-code rule builder, and Backstedge applies that rule against historical match data using real tracked odds rather than synthetic averages. The platform runs the simulation, calculates ROI, strike rate, and worst drawdown automatically, and breaks results out season by season so you can see stability at a glance instead of squinting at one aggregate number. Its stability analysis flags exactly the kind of fragile, single-season-driven results this article warns about, and once a strategy checks out, automated detection flags future matches that qualify under your rule, so you’re not manually re-scanning odds boards. You can also browse published backtest results for classic strategies to see the reporting format in action before building your own. Start with the free plan and run your first odds-range backtest against real historical football data today.
Sources
- Historical Odds API — Backtest Betting Strategies | The Odds API
- Lecture : Range & Adaptive Filters — February 19, 2025
- Aeris Filter: A Strongly and Monotonically Adaptive Range Filter
FAQ
What Is an Odds Range Filter in Sports Betting?
It’s a rule that keeps only bets whose price falls inside a defined interval, like 1.80 to 2.20, so you can measure whether that specific slice of the market is profitable rather than judging a strategy across all odds at once.
How Many Bets Do I Need for a Reliable Backtest?
There’s no fixed cutoff, but most bettors treat a few hundred qualifying bets as a reasonable floor, and results should ideally hold up across multiple individual seasons rather than only in the aggregate.
Should I Use Closing Odds or Real-Time Odds for Backtesting?
Use timestamped odds captured near the moment your rule would have triggered, not closing prices, since TheOddsAPI’s guidance specifically warns that vig-free or mid-market backtests overstate real returns.
What’s the Biggest Mistake Bettors Make With Odds Range Filters?
Scanning results after the fact to find the best-performing range, then presenting that as a strategy. Pre-registering your range and reasoning before running the backtest is the fix.
Can I Combine an Odds Range Filter With Other Rules Like Form or Rest Days?
Yes, and it often sharpens results, but add one filter at a time, re-test after each addition, and treat every combination as its own pre-registered hypothesis rather than stacking rules until something sticks.