12 Field No Code Checklist for Football Betting Strategy Tracking

12 Field No Code Checklist for Football Betting Strategy Tracking
Track betting strategy performance by recording twelve fields per bet, then judging results on three diagnostics: closing line value (CLV), calibration, and segmented return on investment (ROI). CLV tells you if you’re beating the market before the outcome even happens. Calibration tells you if your probabilities match reality. A no-code platform like Backstedge can log and calculate all three automatically, without a spreadsheet in sight.
TL;DR:
- Consistently beating the closing line by 2 to 3 percent CLV from at least 100 bets indicates genuine predictive skill.
- ROI requires at least 500 bets per strategy to reliably measure profit relative to the amount risked.
- Calibration accuracy emerges with about 100 to 150 bets per probability bucket, revealing if your predicted probabilities are honest.
- Breaking down data by league, market type, odds range, bookmaker, and timing helps identify specific areas where your strategy leaks money.
- Automated no-code platforms can track and analyze strategy performance in real time, reducing manual effort and improving decision-making speed.
Table of Contents
- What Data Do You Need to Track Betting Strategy Performance?
- Which Metrics Actually Prove a Betting Edge?
- How Do You Find Where a Strategy Leaks Money?
- When Should You Review Your Results and Act on Them?
- What Charts Show Strategy Performance at a Glance?
- How No-Code Tools Automate Strategy Tracking
- Try It: Build and Backtest Your Strategy on Backstedge
- Sources
- FAQ
What Data Do You Need to Track Betting Strategy Performance?
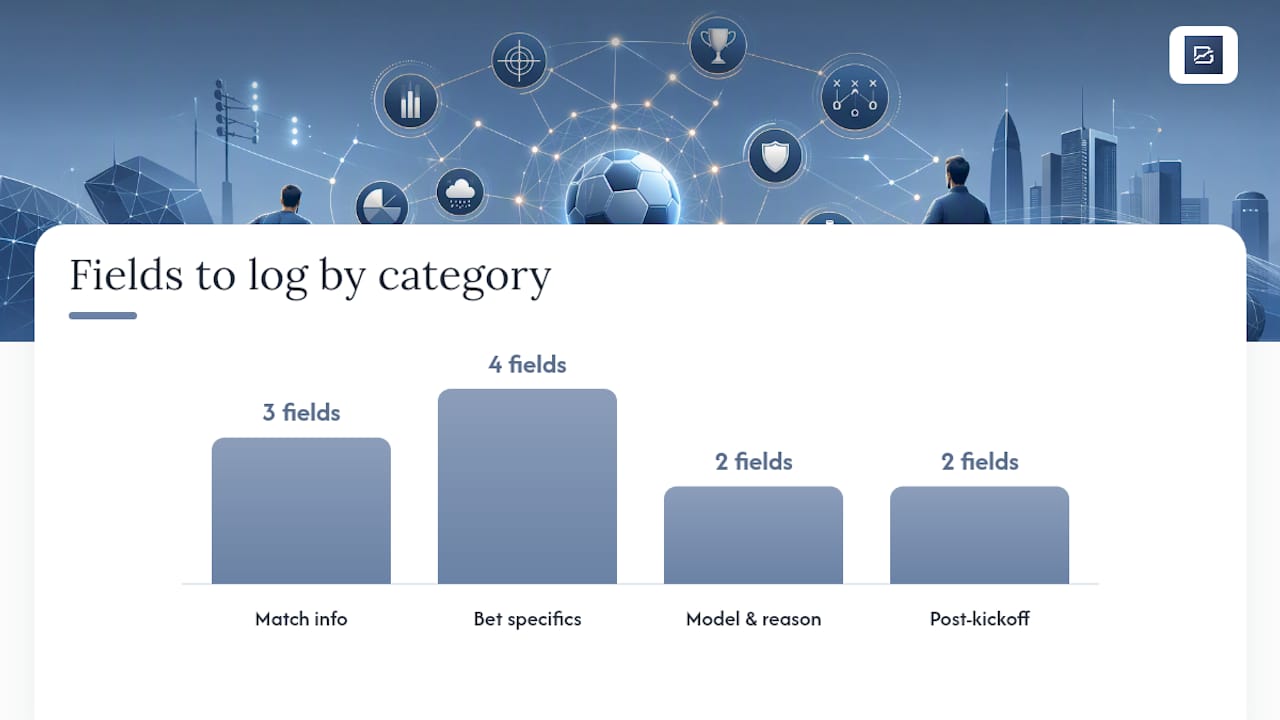
You need enough information to reconstruct every decision after the fact, not just whether it won. The minimum viable dataset for football betting includes these fields, logged at the moment you place the bet:
- Date and competition (league, cup, or friendly)
- Home/away designation and the specific fixture
- Market type (1X2, over/under, both teams to score, Asian handicap, etc.)
- Selection and placed odds
- Stake, recorded in units rather than currency so results stay comparable across time
- Bookmaker name
- Your model’s implied probability for that outcome
- A short note on why you took the bet
Two fields get added after kickoff: the closing odds from the same bookmaker or market, and the final result. Closing odds matter because they’re the market’s last and most efficient price. Compare your placed odds against them and you get CLV, the single best early read on whether you have real skill or just a lucky stretch.
Log everything before kickoff. Betting after the fact, or only recording the bets you remember, quietly deletes your worst decisions from the record and inflates every metric you calculate later. A simple Google Sheet with these columns is enough to start; you can always add fields once you know which ones you actually use.
Which Metrics Actually Prove a Betting Edge?
Raw profit tells you almost nothing on its own. Two bettors can both finish $500 up. One risked $2,000 to get there; the other risked $20,000. ROI, profit divided by total stake, corrects for that and lets you compare strategies of different sizes on equal footing. The catch is that ROI needs volume: results stay noisy until you’ve logged 500 or more bets under one strategy.
CLV moves faster. Compute it by comparing your placed odds to the closing odds on the same selection. A strategy that consistently beats the closing line, averaging positive CLV in the 2 to 3 percent range or better, is showing real predictive skill, even before ROI has caught up. CLV starts giving directional signal from around 100 bets, which makes it the metric to watch while you’re still building sample size; learn more about how betting odds work in South Africa to understand this better in our How betting odds work: A South African guide | BetMzansi.
CLV becomes directionally meaningful from roughly 100 bets, while ROI and calibration buckets need 500-plus bets and 100 to 150 bets per bucket respectively before you can trust them.
Calibration answers a different question: are your predicted probabilities honest? Group your bets into probability buckets (50 to 55 percent, 55 to 60 percent, and so on), then check the actual hit rate in each bucket against the predicted rate. Plot predicted against observed on a chart with a diagonal reference line. Points sitting above the line mean you’re underrating those outcomes; points below mean you’re overconfident.
Round it out with strike rate (win percentage) and max drawdown (your worst peak-to-trough loss run). The strongest signal comes from combining them: positive CLV plus improving calibration plus a drawdown you can stomach is what a trustworthy edge actually looks like. One good metric in isolation proves very little.
How Do You Find Where a Strategy Leaks Money?
Aggregate numbers hide the truth. A strategy can look break-even overall while quietly printing money on one market and bleeding it on another. Slice your data along these lines to find out which:
- League and competition. Some models work in the Premier League and fall apart in Serie A.
- Market type. Separate 1X2 bets from over/under and both-teams-to-score; they behave differently.
- Odds range. Split bets under 2.00, between 2.00 and 3.50, and above 3.50 to see where your pricing holds up.
- Bookmaker. Some books consistently offer worse prices or limit accounts that win.
- Home versus away and time of bet. Early-market bets and late, closer-to-kickoff bets often carry different value.
Keep sample sizes in mind before acting on any single segment. Fifty to 200 bets per slice, depending on how narrow it is, is the rough floor before a pattern is worth trusting rather than dismissing as noise. If your 1X2 picks are dragging down an otherwise solid over/under strategy, the fix is specific: stop betting 1X2 under that model, isolate over/under, and track it separately going forward. If accumulators are quietly eating your bankroll while singles perform fine, split them into their own tracked category rather than blending the two.
When Should You Review Your Results and Act on Them?
Checking your numbers too often is almost as damaging as never checking them. Short losing streaks look like disasters in the moment and mean nothing over a full season. A structured cadence keeps you from overreacting to noise while still catching real problems early.
- Weekly (about 5 minutes): confirm every bet from the week is logged correctly. Data integrity only, no analysis.
- Monthly (30 to 60 minutes): review ROI trend, CLV trend, and whether calibration is drifting in any probability bucket. Make small adjustments if the evidence is clear.
- Seasonal (a full sitting): run the complete audit, season-by-season breakdown, stability across different periods, worst drawdown, and decide whether to keep the strategy as is, modify it, or retire it entirely.
Pro Tip: Before you change a rule based on a monthly review, test it on a walk-forward basis, meaning apply it only to new bets going forward and keep a holdout period untouched. That way you’ll know if the change actually helped instead of just fitting the noise you happened to see.
Change one variable at a time. Adjusting odds range, market, and league simultaneously means you’ll never know which change actually moved the needle.
What Charts Show Strategy Performance at a Glance?
Numbers in a table are accurate but slow to read. A handful of charts will tell you more in ten seconds than a spreadsheet full of formulas will in ten minutes.
- Cumulative P&L with a moving average smooths out day-to-day swings and shows the real trend underneath the variance.
- Calibration plot (predicted probability versus actual hit rate) is the single most revealing diagnostic chart you can build.
- CLV over time and CLV by odds band show whether your edge is stable or concentrated in one price range.
- Drawdown chart and season-by-season P&L reveal how much pain a strategy demands before it pays off.
All of these are buildable in Google Sheets or Excel with a pivot table and a line chart. A tracking platform generates them automatically the moment new results come in.
How No-Code Tools Automate Strategy Tracking
Building this by hand in a spreadsheet works, but it takes real discipline to keep it current every single week. A no-code platform removes that friction. The platform lets you build betting rules visually, without writing a formula or a line of code, then backtest them against historical matches and real closing odds.
Once a strategy is built, the platform calculates CLV, calibration, and stability automatically, and flags future fixtures that match your rules before kickoff, so you’re not scanning fixture lists by hand. Everything updates in real time as new results come in.
- No-code rule builder for defining betting strategies visually
- Multi-season backtests using real historical closing odds
- Automated CLV and stability analysis on every strategy
- Automatic detection of upcoming matches that qualify under your rules
- Real-time tracking and side-by-side comparison of multiple strategies
For classic strategies that already have a published backtest, quote only the figures on that specific Backstedge strategy page, which lists ROI, profit, worst drawdown, number of bets, and win rate for each one.
Try It: Build and Backtest Your Strategy on Backstedge
This platform is an alternative to building your own spreadsheet from scratch: instead of writing formulas for ROI, CLV, and drawdown by hand, you define your rule once and get multi-season backtested results, real closing odds, and stability analysis.
Signing up gets you a rule builder with no coding required, multi-season backtests against real historical matches, and a dashboard where CLV and stability show up automatically instead of living in a separate tab you forget to update. The platform offers a Free plan to get started, plus paid plans for bettors who want deeper analysis and higher usage limits.
Whatever plan you start on, treat your early results with the same caution outlined above: don’t scale your stakes until you’ve cleared 100 bets for a CLV read and several hundred for ROI you can actually trust. Build your strategy on Backstedge and run your first backtest today.
Sources
- Monitoring Your Football Betting Performance: Metrics and Spreadsheets
- Football Betting Tracker: How to Track & Win
- How to Track Your Betting Performance — Find Leaks & Improve ROI | KiqIQ | KiqIQ
- Building a Simple Personal Stats Tracker for Smarter Football Betting (no fancy software needed)
FAQ
What’s the Minimum Number of Bets Before I Trust My Data?
CLV starts giving a directional read from around 100 bets, while ROI needs 500 or more before it’s statistically reliable. Calibration buckets need roughly 100 to 150 bets each to mean anything.
What Is Closing Line Value and Why Does It Matter?
CLV compares the odds you placed against the closing odds on the same selection just before kickoff. Consistently beating the close, averaging 2 to 3 percent positive CLV or higher, is one of the earliest signs a strategy has genuine skill behind it rather than luck.
How Often Should I Review My Betting Strategy?
Check data integrity weekly, review ROI and CLV trends monthly, and run a full audit each season. This cadence catches real problems while filtering out the short-term noise that makes bettors abandon good strategies too early.
Can I Track This Without a Spreadsheet?
Yes. A platform like Backstedge automates the data collection, CLV calculation, and calibration analysis so you’re not maintaining formulas by hand, and its Free plan lets you build and backtest a rule before deciding whether to upgrade.
What Causes a Strategy to Look Profitable but Actually Leak Money?
Blending markets, leagues, or bet types together in one aggregate number hides where the losses actually happen. Segmenting by market, odds range, and bookmaker, with the sample-size cautions covered above, usually exposes exactly which slice is dragging the rest down.