Short Term Results Mislead Bettors: Variance in Sports Betting

Short Term Results Mislead Bettors: Variance in Sports Betting
Variance is the predictable randomness around expected value that produces hot and cold runs; it does not disprove a profitable process. The practical fix is not “trust the process” as a slogan. It’s tracking sample size, closing line value, and bankroll rules that keep you solvent long enough for your edge to actually appear.
TL;DR:
- Short-term results at around 100 bets can still vary by plus or minus 10 units, meaning a genuine edge may not reveal itself immediately.
- Low-variance bets, such as short favorites or singles with under -200 odds, are better suited for small bankrolls or early testing phases due to smaller swings.
- Achieving reliable patterns typically requires at least 200 bets, with 500 to 1,000 bets providing stronger evidence of skill or edge presence.
- Managing stake sizes of 1% to 3% of the bankroll and diversifying across uncorrelated markets help keep variance from threatening your bankroll.
- Using backtesting tools to evaluate strategies over multiple seasons offers insight into the worst drawdowns and real variance before risking live capital.
Table of Contents
- What Does Variance Mean in Sports Betting?
- High Variance vs Low Variance Bets: Which Fits Your Bankroll?
- Why Do Results Take So Long to Reflect Your Edge?
- How Bad Can a Real Edge Look in the Short Run?
- The Mental Traps Variance Sets for Bettors
- How to Manage and Reduce the Impact of Variance
- What the Data Says: Over 2.5 Goals Backtested Over 5 Seasons
- How Many Bets Do You Need Before Trusting the Result?
- Two Quick Checks You Can Run Right Now
- Stop Guessing and Start Backtesting Your Edge
- Sources
- FAQ
What Does Variance Mean in Sports Betting?
Variance measures how spread out your results are around the outcome you’d expect on average. In statistics, it’s the square of the standard deviation, which is easier to reason about because it’s expressed in the same units as your bets, units of stake rather than squared units.
A single bet at standard odds of -110 carries a standard deviation of roughly 1 unit. That’s the typical swing size for one wager, win or lose. Standard deviation doesn’t stay flat as you place more bets. It grows with the square root of the number of bets, so N wagers carry a standard deviation of about 1 × √N units.
Statistic Callout: At -110 pricing, 100 bets produce a standard deviation near 10 units, and 1,000 bets produce roughly 32 units of swing, even for a bettor with zero long-run edge.
That √N relationship is the entire reason short-term results mislead people. A z-score puts a number on how surprising a result actually is. It’s your result minus the expected result, divided by the standard deviation of that result. A z-score of 2 or higher means the outcome would happen by chance less than about 5% of the time. Below that, you’re likely just looking at noise, not skill or its absence.
High Variance vs Low Variance Bets: Which Fits Your Bankroll?
Not every wager carries the same risk profile, even at identical expected value. A same-EV bet can look wildly different depending on how the payout is structured.
- High variance: parlays, longshot moneyline underdogs, player prop longshots, anything with odds longer than +300.
- Low variance: short-priced favorites, straight singles, moneyline bets under -200.
- Same EV, different feel: a +900 longshot with a 10% true win rate and a -110 favorite with a 52.4% true win rate can carry identical long-run EV, but the longshot swings far harder around that average.
- Practical match: small bankrolls or bettors early in testing a strategy do better sticking to low-variance singles; larger, well-capitalized bankrolls can absorb the swings that parlays and longshots bring. If you’re exploring parlay strategy specifically, ParlayGeeks breaks down how stacking legs compounds variance fast.
Neither category is inherently wrong. A high-variance bet is a legitimate tool, but only paired with stake sizing that assumes you’ll go cold for a while.
Why Do Results Take So Long to Reflect Your Edge?
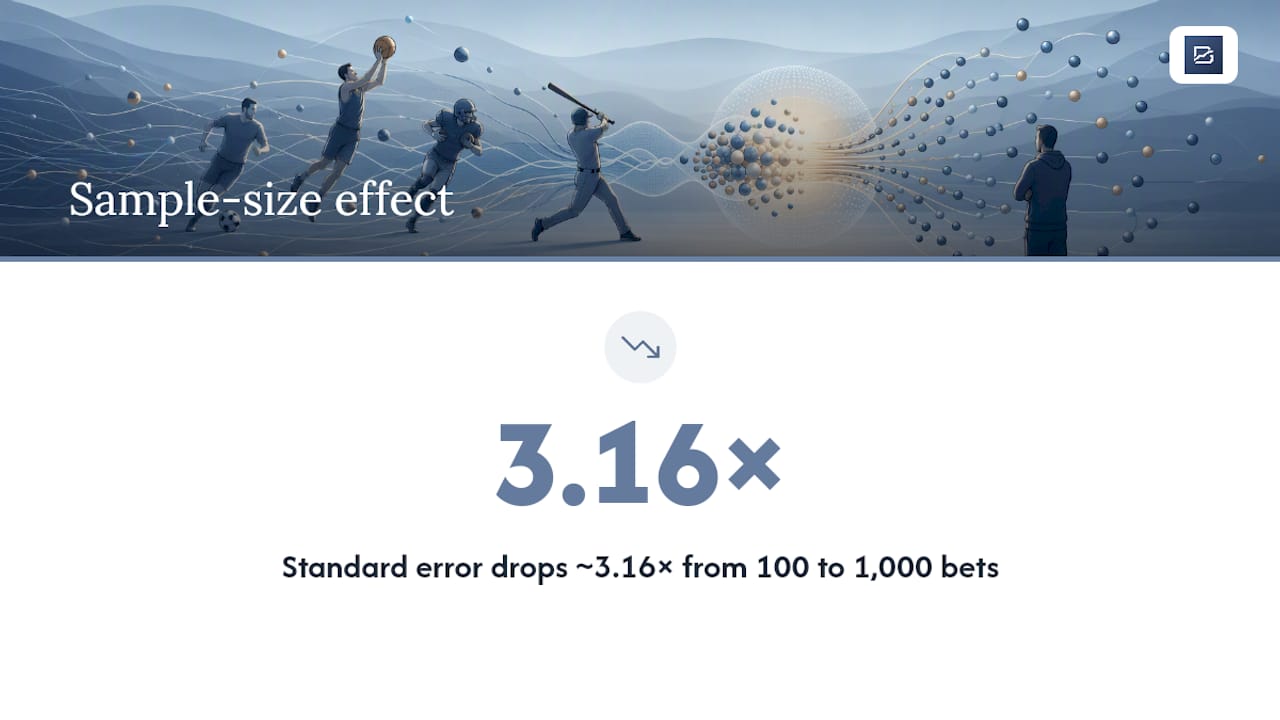
The Law of Large Numbers states that as your sample size grows, your average result converges toward the true expected value. It says nothing about how fast that happens, and for bettors, “eventually” can mean thousands of wagers.
The standard error of your win rate shrinks proportionally to σ divided by √N. Doubling your sample size doesn’t cut your uncertainty in half.
Statistic Callout: Going from 100 bets to 1,000 bets, a tenfold increase in sample, only shrinks your standard error by roughly a factor of 3.16, not 10.
That’s why a hot month or a bad quarter tells you almost nothing on its own. The NIST Engineering Statistics Handbook lays out the sample-size math behind this precisely: precise variance estimates require far larger n than most people intuitively assume.
How Bad Can a Real Edge Look in the Short Run?
Here’s what that √N scaling actually looks like in practice, using rough one-standard-deviation and two-standard-deviation ranges around a break-even expectation at -110 pricing:
- 10 bets: standard deviation around 3.2 units. A losing stretch of 4 to 5 units is unremarkable, not a signal anything is wrong.
- 100 bets: standard deviation around 10 units. A two-standard-deviation swing, meaning a 20-unit drawdown, still falls within normal variance for a break-even or even a modestly profitable bettor.
- 1,000 bets: standard deviation around 32 units. A bettor with a genuine 2% edge can still show a net loss at this sample size once in a while, though it becomes far less likely than at 100 bets.
The z-score check ties this together: take your actual profit in units, subtract your expected profit, divide by the standard deviation for that sample size. Anything under roughly 1.5 to 2 is well inside the range chance alone would produce.
The Mental Traps Variance Sets for Bettors
Variance doesn’t just distort your results. It distorts your decisions, because the human brain is wired to find patterns in noise.
- Recency bias: treating your last 10 bets as more informative than your last 200, when the opposite is almost always true statistically.
- Result-oriented thinking: judging a bet by whether it won, not by whether the process and price were sound.
- Confirmation bias: noticing every losing bet during a downswing and forgetting the winners that followed the identical logic.
The fix is behavioral, not statistical: flat staking removes the temptation to size up after a win or down after a loss, pre-committing your bankroll rules before a session starts removes in-the-moment rationalizing, and a mandatory pause before changing anything gives the emotion time to fade.
Pro Tip: Before touching your strategy after a rough stretch, ask three questions: Is my sample size even large enough to mean anything? Has my closing line value stayed positive? Was I actually following my own rules, or did I drift?
How to Manage and Reduce the Impact of Variance
Variance is not fully avoidable, and trying to eliminate it entirely usually just means eliminating your edge along with it. What you can do is manage its practical impact so a bad stretch never threatens your bankroll or your judgment.
- Size your units conservatively. Risking 1% to 3% of your bankroll per bet lets you absorb a 10 or even 15-bet losing streak, which will happen eventually to every bettor, without meaningful damage.
- Choose a staking method deliberately. Flat staking is simple and predictable, keeping swings proportional to your bankroll size. Fractional Kelly staking, betting a fraction of the “full Kelly” amount, scales bet size with edge and bankroll but amplifies variance if you overestimate your edge, so most disciplined bettors run at a quarter or half Kelly at most.
- Diversify across uncorrelated markets. Spreading action across different leagues, bet types, and matchups smooths your equity curve. Stacking correlated legs into a single multi-leg bet does the opposite: it concentrates variance instead of spreading it.
- Track closing line value religiously. CLV converges faster than raw win rate, meaning a bettor consistently beating the closing number is showing real process quality well before their win/loss record catches up statistically.
- Log the right metrics every single bet. Stake, odds, expected value, closing odds, resulting CLV, running z-score, and current drawdown. Without this record, you’re guessing at whether a downswing is normal or a sign something broke.
Pro Tip: Run a quick stress test before committing real money to a new staking plan: simulate a 10-bet losing streak at your intended unit size and check whether your remaining bankroll still lets you operate normally. If a realistic bad streak wipes out a third of your bankroll, your units are too big.
What the Data Says: Over 2.5 Goals Backtested Over 5 Seasons
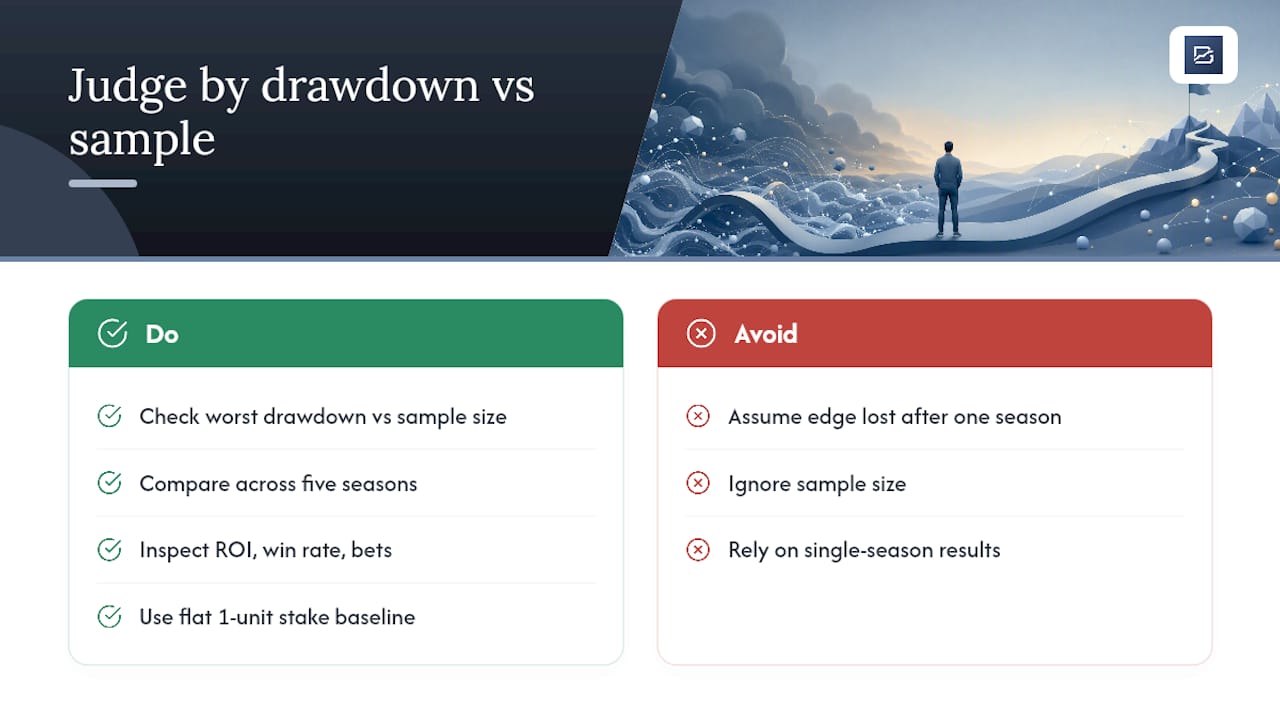
If you want to see variance play out in a real, published strategy rather than a hypothetical, Backstedge’s over 2.5 goals strategy page shows five seasons of closing odds, season-by-season results, ROI, win rate, number of bets, and worst drawdown at flat one-unit stakes. Reading a strategy’s worst drawdown against its overall sample size is exactly the kind of check this article recommends: a rough season doesn’t necessarily mean the underlying edge is gone, but it only means that if the sample behind it is large enough to judge fairly.
How Many Bets Do You Need Before Trusting the Result?
Rough benchmarks help set expectations, even though they’re not hard statistical cutoffs. Around 50 bets tells you almost nothing reliable. By 200 bets, especially combined with consistently positive CLV, patterns start becoming meaningful. At 500 to 1,000 bets, you’re looking at genuinely strong evidence one way or the other.
Statistic Callout: Academic sampling research on design effects, factors that increase the variance of an estimate beyond simple random sampling, finds that required sample sizes can roughly double when the data has structure or dependence baked in, which is exactly what correlated bet types introduce.
If you want a genuinely precise variance estimate rather than a rule of thumb, the NIST sample-size formulas referenced earlier let you calculate the exact n required for a target confidence level and margin of error, and the honest answer for most bettors is that it’s a bigger number than they’d like.
Two Quick Checks You Can Run Right Now
You don’t need a statistics degree to sanity-check a streak. Two calculations cover most situations.
- Z-score for 100 bets at -110: take your net profit in units, subtract 0 (assuming a break-even baseline), divide by 10 (the standard deviation for 100 bets at this pricing). A result under 2 means your streak, good or bad, is well within normal variance.
- Bankroll stress test for a 10-bet losing streak: at 1% units, a 10-bet losing streak costs about 10% of bankroll. At 5% units, the same streak costs roughly half your bankroll. Run this before picking a unit size, not after a bad month forces the question.
After any rough streak, check your sample size, confirm your CLV is still positive, verify you priced bets fairly, and make sure your bet selection stayed consistent with your original rules before you touch anything.
Stop Guessing and Start Backtesting Your Edge
The platform lets you build a betting strategy with no-code rules, run it against real historical matches, and see how it would have performed, including the drawdowns variance would have thrown at you along the way. Instead of waiting 500 live bets to find out if your idea holds up, you back-test it against five seasons of real closing odds first.
That stability analysis is the direct answer to everything covered above: instead of guessing whether a losing streak is normal variance or a broken strategy, you can see the worst historical drawdown for your exact rule set before you ever risk a dollar on it. The Free plan lets you start building and backtesting strategies right away, and the Pro plan at $49 per month or Advanced at $79 per month unlock deeper stability analysis, automated tracking of qualifying future matches, and expanded backtest quotas once you’re ready to scale up. Head to Backstedge and build your first strategy against real historical data before your next bet.
Sources
- NIST/Handbook: Sample size determination for estimating a variance
- Respondent-driven sampling design effects (PMC article)
- Variance vs Skill: How to Tell What’s Real and
FAQ
How Do You Reduce Variance in Sports Betting?
You reduce its practical impact, not the variance itself, through flat or conservative fractional staking, diversifying across uncorrelated markets, and avoiding correlated multi-leg parlays. Tracking closing line value also helps you confirm your edge is real long before your win/loss record does, so you’re less tempted to change a working process during a normal cold stretch.
What Is the Variance of a Bet?
The variance of a single bet is the squared spread of its possible outcomes around the expected value; standard deviation, its square root, is easier to work with because it’s expressed in the same units as your stake. A single wager at -110 odds carries a standard deviation of roughly 1 unit, and that figure scales with the square root of your number of bets as your sample grows.
What Does Variance Mean in Sports?
In sports betting specifically, variance describes the natural swings in results that happen even when your underlying edge stays constant. A bettor with a real advantage can still show a losing record over 100 or 200 bets purely from randomness, which is why judging a strategy on a small sample is unreliable.
How Many Bets Do I Need Before My Results Mean Anything?
Around 50 bets tells you almost nothing statistically reliable. Meaningful signal typically starts emerging around 200 bets when paired with consistent CLV, and 500 to 1,000 bets gives considerably stronger evidence of real skill or its absence.
Can Backstedge Help Me Understand My Own Variance?
Yes. Backstedge’s backtesting tool applies your exact rule set to historical matches and shows season-by-season results, worst drawdown, and win rate, so you can see how much natural variance your strategy has produced historically before betting it live. Pricing and full feature details are available on the Backstedge site.