Five Season Backtest: Both Teams to Score Workflow for Bettors

Five Season Backtest: Both Teams to Score Workflow for Bettors
A data-driven both teams to score strategy can be a repeatable edge, but only if you require venue-adjusted scoring probabilities and filter out clean-sheet-prone teams before you touch the market. The simplest version: shortlist matches where both sides clear two of three thresholds (scoring rate, xGA, shot volume) and only bet when your estimated probability beats the implied odds by at least 5%. Run that screen on today’s card, or open Backstedge to see how it performs across five real seasons before risking anything.
TL;DR:
- Venue-adjusted scoring rates, clean sheet rates, and shot volume are critical for accurately estimating BTTS probabilities, especially over recent matches rather than season-wide averages.
- Running a quick filter of xG, xGA, and shots over the last 6-12 matches can identify favorable betting opportunities with typically at least a 5% edge over market implied probabilities.
- Lineup changes, tactical shifts, and opponent strength adjustments can significantly impact BTTS likelihood, making lineup confirmation before kickoff essential.
- In-play signals like early goals, rising xG, and tactical substitutions provide opportunities to increase stakes when the underlying data supports a higher probability.
- A strategy tested over five seasons shows consistent performance, with variation in season results emphasizing the importance of large sample sizes and continuous recalibration.
Table of Contents
- What Actually Drives BTTS Probability?
- How Do You Screen Matches Before Kickoff?
- What In-Play Signals Actually Move the Odds?
- How Should You Stake BTTS Bets?
- When Does BTTS Betting Go Wrong?
- Which BTTS Variations Are Worth Betting?
- What the Data Says: BTTS Backtested Over 5 Seasons
- Try It Yourself: Build and Backtest Your BTTS Filters in Backstedge
- Primary Sources and Suggested Reading
- Sources
- FAQ
What Actually Drives BTTS Probability?
The math behind both teams to score is simpler than most bettors treat it. P(BTTS) equals the probability that Team A scores multiplied by the probability that Team B scores. That’s the whole formula. The hard part is estimating those two probabilities honestly, because raw season averages lie to you constantly.
A team that scores 1.8 goals a game at home might manage 0.9 on the road. A defense that looks solid overall might be leaking goals specifically against attacking opponents. That’s why venue splits matter more than season totals, and why serious BTTS analysis starts with four numbers per team, not one.
Here’s what to pull before you estimate anything:
- Scoring rate, split by venue. Home and away goals per game are rarely close to identical.
- Clean sheet rate. A team keeping clean sheets in 40% of matches is a red flag for BTTS Yes, not a coincidence.
- Failed-to-score (FTS) rate. How often does this team draw a blank, especially away from home?
- xG and xGA over a rolling window. Actual goals bounce around on small samples; expected goals smooth out the noise from a lucky deflection or a missed penalty.
Pull these across the last 6 to 12 matches, not the full season. A team’s form changes with injuries, tactical shifts, and fixture congestion, and a 30-game average buries all of that.
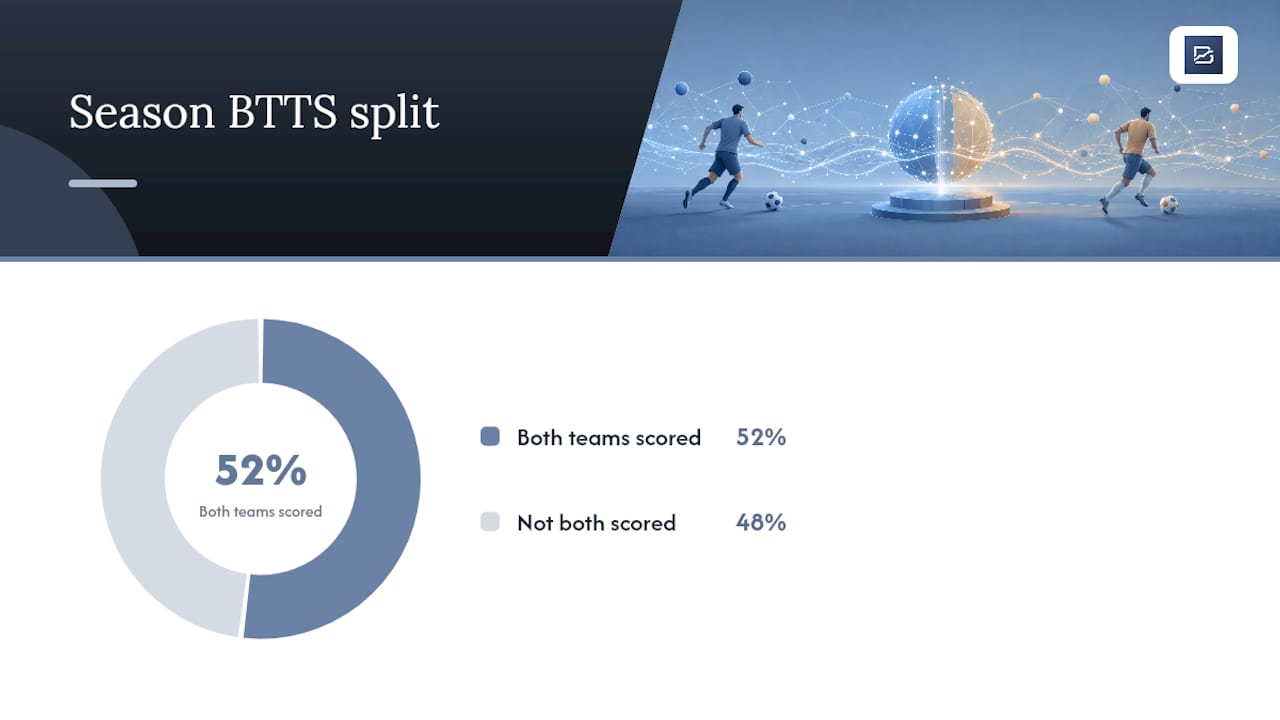
BTTS baseline: Across a full Premier League season, both teams score in roughly 50 to 55% of matches. That’s your starting point. Anything you add to the analysis needs to move your estimate meaningfully away from that midpoint, or you’re just betting the market average at worse odds.
How Do You Screen Matches Before Kickoff?
You don’t need twenty data points to flag a candidate match. You need three, checked fast, then a couple of confirmations before you commit money.
- Run the first-pass numeric filter. Both teams should clear at least two of these three: xG for at or above 1.4, xGA at or above 1.2, and shots at or above 12 per game over the last 6 to 12 matches.
- Confirm with secondary data. Check shots on target, head-to-head scoring history, and confirmed lineups. A missing striker or an unfamiliar backup keeper changes everything.
- Adjust for opponent strength. Shave 10 to 15% off your estimate against a top-six defense; add 5 to 10% against a bottom-half side that leaks chances regardless of who they’re facing.
- Convert market odds to implied probability and compare. If your model says 61% and the market implies 56%, you’ve got a real edge. If the gap is smaller than 5%, pass.
- Time the check right. Run the full screen 90 to 60 minutes before kickoff, then re-confirm the moment lineups drop.
Pro Tip: Lineup news moves BTTS probability more than almost any other single input. A rotated forward line or a backup goalkeeper can swing your estimate by 8 to 10 percentage points in either direction, so never lock in a stake before the official team sheets are out.
What In-Play Signals Actually Move the Odds?
Live betting on BTTS rewards patience more than speed. The signals worth acting on are concrete: an early goal conceded alongside rising xG and shots on target for the trailing team, a visible tactical shift toward more attackers, or a red card against a defense that’s now down a man.
- Watch rolling 15 to 25 minute xG and shots-on-target windows rather than the match total. A team that’s created three big chances in the last 20 minutes tells you more than their first-half stat line.
- Demand a bigger edge in-play than pre-match, roughly 7 to 10% over the implied probability, because live odds move fast and liquidity thins out.
- Size in-play stakes smaller than your pre-match bets by default. The information is fresher, but so is the risk of the market correcting before your bet settles.
A team trailing 0-1 at the 30th minute with rising xG and a substitution bringing on a second striker is a textbook trigger. A team trailing 0-1 with flat underlying numbers and no tactical change is just a team losing.
How Should You Stake BTTS Bets?
Your edge size should dictate your stake size, every single time. Guessing at stakes is how a solid model still loses money over a season.
- Match stake to edge. A 5 to 6% edge over implied probability gets 1% of bankroll. A 7 to 9% edge gets 1.5 to 2%. A 10%+ edge gets up to 3%, which is also your hard cap per bet regardless of how confident you feel.
- Use half-Kelly if you’re betting recreationally. Full Kelly staking is too aggressive for anyone without a large, proven sample size behind their model.
- Cut stakes after a losing streak. Reduce sizing by 25% after three straight losses, then rebuild gradually once results stabilize.
- Keep a record of every bet. Log the date, match, league, your estimated probability, the odds taken, your stake, the result, and your reasoning. Recalibrate your model every 50 to 100 bets against actual outcomes.
Pro Tip: If your model says 61% and the market implies 56%, that’s a 5% edge, which lands you at 1% of bankroll. On a $2,000 roll, that’s a $20 stake, not a gut-feel $100 because you “really like this one.”
When Does BTTS Betting Go Wrong?
Most BTTS losses trace back to the same handful of errors, and they’re almost all avoidable with a quick sanity check before you stake.
- Backing BTTS Yes against a home clean-sheet machine. If a team keeps clean sheets at home in 40% or more of matches, that’s a strong signal to back BTTS No unless something specific has changed.
- Ignoring high away FTS rates. An away team that fails to score in over 40% of road matches is not a reliable BTTS leg, no matter how good they look at home.
- Skipping lineup news. A missing main striker or first-choice keeper can flip your estimate by double digits, and plenty of bettors stake before checking.
- Using season-long averages instead of venue splits. A team’s overall numbers can hide a huge home/away gap that makes your estimate wrong in one direction consistently.
- Chasing a short goal streak with no xG support. Three straight games with goals means little if the underlying shot and chance data hasn’t moved.
Which BTTS Variations Are Worth Betting?
Not every BTTS-adjacent market deserves the same stake or the same confidence level.
- BTTS & Over 2.5 fits genuinely open matches where both teams show high xG and shot volume. The odds are better, but the two outcomes are correlated, so only use it when the data clearly points to a high-scoring game.
- BTTS & Win suits a favorite likely to score but also prone to conceding, like a home favorite with an leaky defense. It’s a specific profile, not a default add-on.
- First-half BTTS lands far less often, around 20 to 25%, and BTTS in both halves is rarer still at roughly 5 to 8%. Treat both as high-variance markets and stake accordingly small amounts unless your edge is unusually large.
Adding an Over or a Win filter only improves your expected value when the underlying numbers already support it. Bolting it on for better odds without the data behind it just adds risk.
What the Data Says: BTTS Backtested Over 5 Seasons
Backstedge ran this exact strategy, both teams to score on every match, across five major football leagues and five seasons from 2021/22 through 2025/26, using real closing odds and flat one-unit stakes. The full backtest is published on the Backstedge BTTS strategy page, including season-by-season breakdowns, the worst drawdown recorded, and the total number of bets placed.
The value of a five-season test isn’t the headline ROI. It’s whether the strategy held up consistently or whether one strong season is carrying the whole average. A strategy with a good overall number but a brutal single-season stretch tells you something very different about risk than one that performs steadily year over year.
| What to check on the page | Why it matters |
|---|---|
| ROI and total profit | The bottom-line return on flat one-unit stakes |
| Worst drawdown | How much bankroll stress the strategy actually produced |
| Number of bets | Whether the sample size is large enough to trust |
| Win rate | How often the bet actually landed versus the market’s pricing |
| Season-by-season results | Whether performance was consistent or driven by one outlier year |
Check the real closing odds and season splits yourself before deciding whether this matches how you’d actually want to bet it.
Try It Yourself: Build and Backtest Your BTTS Filters in Backstedge
Everything covered above, the xG thresholds, the clean-sheet filters, the odds-value requirement, can be built as a rule set inside Backstedge without writing a line of code or opening a spreadsheet.
Backstedge lets you define your own screening criteria visually, then run it against historical matches with real closing odds instead of guessing how a strategy might have performed. The platform’s stability analysis shows you whether a strategy’s returns held up across different seasons or leaned on one lucky stretch, and automated tracking flags qualifying matches on future fixtures so you’re not rebuilding your screen every week by hand.
Start with three steps. First, open Backstedge and create a rule set matching the numeric screen covered here, your xG, xGA, and shots thresholds. Second, run it against the same five-season window Backstedge already published for the standard both teams to score strategy. Third, compare your version’s ROI and drawdown against the published baseline to see whether your added filters actually improve on it. The Free plan lets you start building immediately; paid plans unlock expanded features and higher quotas—see Backstedge’s pricing page for current details.
Primary Sources and Suggested Reading
- Backstedge’s BTTS backtest: the five-season performance data referenced above.
- Planete Football’s statistical approach: league baselines and calibration guidance.
- GG Bettings’ screening workflow: xG and shot-based filters.
- BettingNews’ BTTS guide: broader market context.
- BeGambleAware: support if betting stops feeling like a hobby.
Sources
- How to Predict Both Teams to Score: A Statistical Approach | Planete Football
- How to find value in both teams to score markets using xG, shots and tactical context - GG Bettings
FAQ
What Are the Best Bets for Both Teams to Score Today?
There’s no fixed daily list, since the right BTTS bets depend on that day’s matchups, form, and lineup news. Run the numeric screen covered above (xG, xGA, shots, clean-sheet rate) against the day’s fixtures and only shortlist matches where your estimated probability beats the market’s implied odds by at least 5%.
Which Odds Are Best for BTTS?
The best odds are the ones offering genuine value against your own probability estimate, not simply the highest number on offer. Convert the market odds to implied probability first; if your model, built on venue-adjusted scoring rates and xG, comes in 5% or more above that implied figure, the odds are worth taking.
What Are the Best BTTS Predictions for Today?
Reliable BTTS predictions come from checking scoring rates, clean sheet rates, FTS rates, and xG/xGA for both teams involved, not from a single tipster’s pick. Backstedge’s published five-season backtest shows how a rules-based version of this approach performed across real closing odds, which is a more useful benchmark than any single day’s predictions.
Is BTTS Better Than Over/Under?
Neither market is inherently better. BTTS depends on both teams scoring at least once regardless of total goals, while over/under depends purely on the combined goal count, so they suit different match profiles. A tight, low-scoring match can still produce a BTTS Yes at 1-1, while a lopsided 4-0 win fails BTTS despite easily clearing Over 2.5.
Does Backstedge Only Cover Football Betting Strategies?
Yes. Backstedge is built specifically for football (soccer) strategies like both teams to score, home favorites, and over 2.5 goals, with backtesting based on real historical match odds. It does not cover other sports.